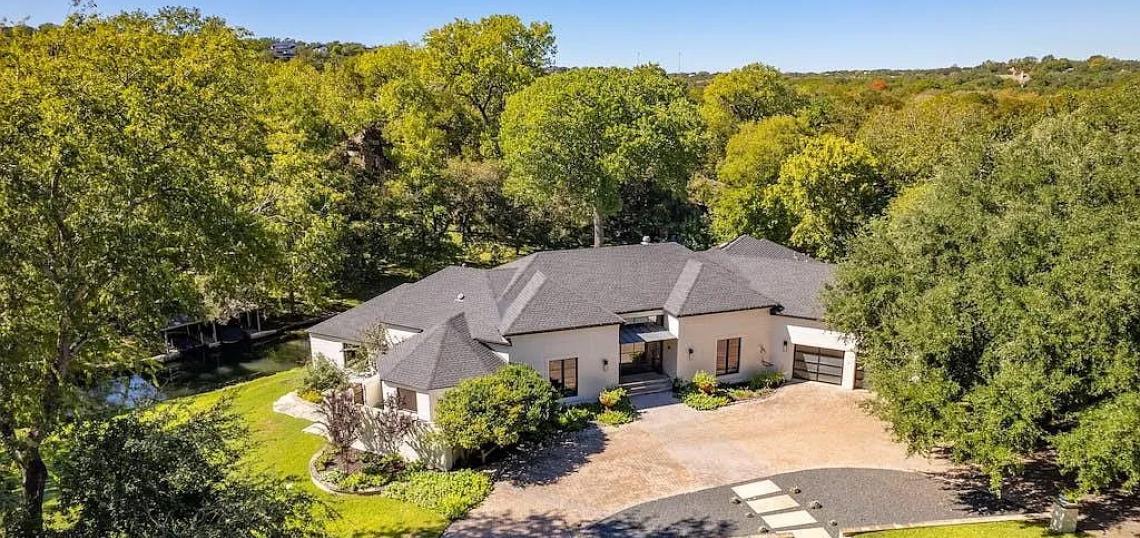
Austin-area homebuyers saw more choices to be had in the local housing market last month, as inventory increases and both sales and median sale price dipped year-over-year.
In October, active listings across the Austin-Round Rock-San Marcos MSA increased 7.3 percent year-over-year to 11,599 listings, according to the latest Central Texas Housing Report released by Unlock MLS. The increase brought the total months of inventory for the region to 5.1, up 0.5 months compared to the same month last year.
Metro home sales fell 1.5 percent year-over-year, to 2,248 closed sales, while the median sale price dropped to $430,000, 3.2 percent less than it was this time last year.
More of ABoR’s October intel is below.
Austin-Round Rock-San Marcos MSA
- 2,248 – Residential homes sold, 1.5% less than October 2023.
- $430,000 – Median price for residential homes, 3.2% less than October 2023.
- 3,333 – New home listings on the market, 7.4% more than October 2023.
- 11,599 – Active home listings on the market, 9.3% more than October 2023.
- 2,344 – Pending sales, 13.0% more than October 2023.
- 5.1 – Months of inventory, 0.5 months more than October 2023.
- $1,270,475,501 – Total dollar volume of homes sold, 1.0% less than October 2023.
- 92.7% – Average close to list price, compared to 93.3% in October 2023.
City of Austin
- 716 – Residential homes sold, 0.8% less than October 2023.
- $565,000 – Median price for residential homes, 0.5% less than October 2023.
- 1,170 – New home listings on the market, 1.7% more than October 2023.
- 4,249 – Active home listings on the market, 10.4% more than October 2023.
- 764 – Pending sales, 22.0% more than October 2023.
- 5.9 – Months of inventory, 0.6 months more than October 2023.
- $553,060,088 – Total dollar volume of homes sold, 1.8% more than October 2023.
- 91.4% – Average close to list price, compared to 92.1% in October 2023.
Travis County
- 979 – Residential homes sold, 2.5% more than October 2023.
- $510,000 – Median price for residential homes, flat to October 2023.
- 1,579 – New home listings on the market, 4.5% more than October 2023.
- 5,702 – Active home listings on the market, 9.4% more than October 2023.
- 1,006 – Pending sales, 16.8% more than October 2023.
- 5.8 – Months of inventory, 0.4 months more than October 2023.
- $691,527,907 – Total dollar volume of homes sold, 4.7% more than October 2023.
- 91.8% – Average close to list price, compared to 92.6% in October 2023.
Williamson County
- 807 – Residential homes sold, 3.1% less than October 2023.
- $420,000 – Median price for residential homes, 2.3% less than October 2023.
- 1,028 – New home listings on the market, 7.1% more than October 2023.
- 3,369 – Active home listings on the market, 9.2% more than October 2023.
- 835 – Pending sales, 11.3% more than October 2023.
- 4.2 – Months of inventory, 0.5 months more than October 2023.
- $384,263,366 – Total dollar volume of homes sold, 4.2% less than October 2023.
- 93.4% – Average close to list price, compared to 93.8% in October 2023.
Hays County
- 315 – Residential homes sold, 7.8% less than October 2023.
- $359,000 – Median price for residential homes, 5.5% less than October 2023.
- 534 – New home listings on the market, 20.8% more than October 2023.
- 1,740 – Active home listings on the market, 6.6% more than October 2023.
- 354 – Pending sales, 11.3% more than October 2023.
- 5.4 – Months of inventory, 0.7 months more than October 2023.
- $140,077,628 – Total dollar volume of homes sold, 11.6% less than October 2023.
- 93.2% – Average close to list price, compared to 93.0% in October 2023.
Bastrop County
- 114 – Residential homes sold, 4.4% more than October 2023.
- $355,000 – Median price for residential homes, 1.1% less than October 2023.
- 152 – New home listings on the market, 1.3% less than October 2023.
- 654 – Active home listings on the market, 23.2% more than October 2023.
- 119 – Pending sales, 8.2% more than October 2023.
- 5.7 – Months of inventory, 0.8 months more than October 2023.
- $44,790,742 – Total dollar volume of homes sold, 1.5% more than October 2023.
- 92.6% – Average close to list price, compared to 93.5% in October 2023.
Caldwell County
- 33 – Residential homes sold, 13.8% less than October 2023.
- $262,990 – Median price for residential homes, 13.5% less than October 2023.
- 40 – New home listings on the market, 14.3% more than October 2023.
- 136 – Active home listings on the market, 9.9% less than October 2023.
- 30 – Pending sales, 16.7% less than October 2023.
- 4.1 – Months of inventory, 0.3 months more than October 2023.
- $9,815,857 – Total dollar volume of homes sold, 20.2% less than October 2023.
- 94.1% – Average close to list price, compared to 97.6% in October 2023.


