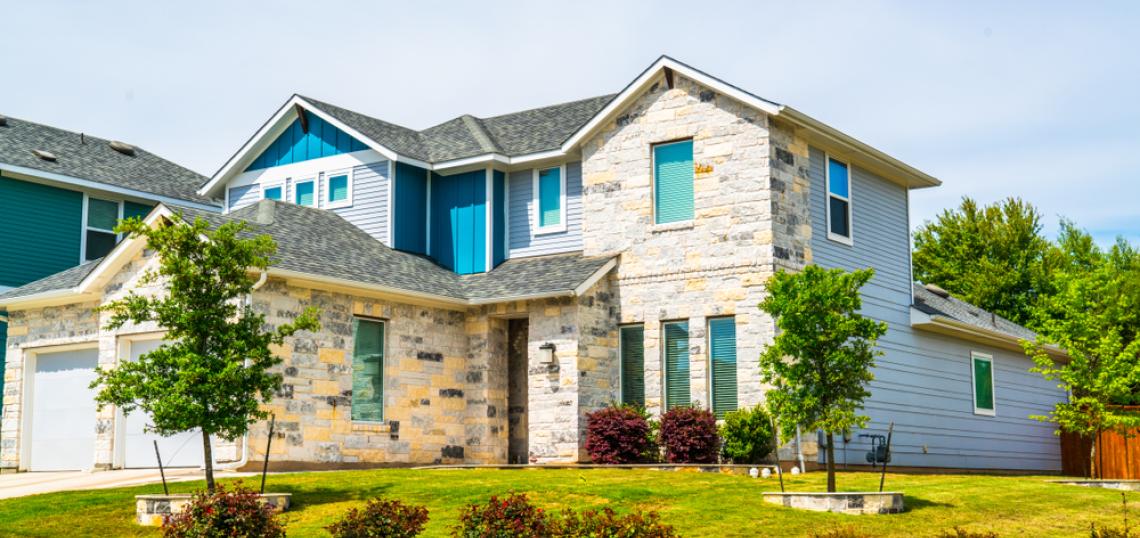
The median home price across the Austin-Round Rock metro dropped 7.5 percent, to $435,000, in October, according to the Austin Board of Realtors' October 2023 Central Texas Housing Market Report. In sunnier news, at least for ABoR, closed sales closed sales rose 4 percent, to 2,337 — although sales dollar volume decreased 1.5 percent year over year, to about $1.3 billion, across the same area.
Homes spent an average of 68 days on the market, up 21 days from October 2022, and housing inventory increased 0.7 months to 3.2 months of inventory. New listings dipped 0.8 percent to 3,202 listings, active listings increased 5.2 percent year over year to 9,942 listings, and pending listings rose 12 percent year over year to 2,257 listings, ABoR reports.
ABoR's regional breakdown of the October numbers is below.
City of Austin
- 602 – Residential homes sold, 3.5% less than October
- $540,000 – Median price for residential homes, 1.8% less than October
- 977 – New home listings on the market, 2.6% less than October
- 2,917 – Active home listings on the market, 12.7% more than October
- 564 – Pending sales, 3.3% more than October
- 4.1 – Months of inventory, 1.3 months more than October 2022.
- $413,742,262 – Total dollar volume of homes sold, 4.4% less than October
Travis County
- 957 – Residential homes sold, 7.7% less than October
- $524,500 – Median price for residential homes, 1.2% less than October
- 1,519 – New home listings on the market, 1.8% less than October
- 4,798 – Active home listings on the market, 9.6% more than October
- 909 – Pending sales, 0.3% less than October
- 4.2 – Months of inventory, 1.2 months more than October 2022.
- $668,881,399 – Total dollar volume of homes sold, 7.2% less than October
Williamson County
- 844 – Residential homes sold, 11.2% more than October
- $424,990 – Median price for residential homes, 7.1% less than October
- 985 – New home listings on the market, 8.5% less than October
- 2,786 – Active home listings on the market, 12.6% less than October
- 794 – Pending sales, 14.1% more than October
- 3.2 – Months of inventory, the same amount as October 2022.
- $403,613,886 – Total dollar volume of homes sold, 4.1% more than October
Hays County
- 360– Residential homes sold, 21.6% more than October
- $373,294 – Median price for residential homes, 8.7% less than October
- 463 – New home listings on the market, 21.5% more than October
- 1,594 – Active home listings on the market, 24.7% more than October
- 370 – Pending sales, 44.5% more than October
- 4.4 – Months of inventory, 1.0 month more than October 2022.
- $167,405,638 – Total dollar volume of homes sold, 6.3% more than October
Bastrop County
- 125 – Residential homes sold, 6.8% more than October
- $349,850 – Median price for residential homes, 3.9% less than October
- 168 – New home listings on the market, 2.9% less than October
- 570 – Active home listings on the market, 16.1% more than October
- 125 – Pending sales, 5.9% more than October
- 4.7 – Months of inventory, 0.9 months more than October 2022 and the highest inventory in the MSA.
- $49,146,166 – Total dollar volume of homes sold, 1.8% less than October
Caldwell County
- 51 – Residential homes sold, 45.7% more than October
- $318,480 – Median price for residential homes, 0.2% more than October
- 67 – New home listings on the market, 31.4% more than October
- 194 – Active home listings on the market, 71.7% more than October 2022.
- 59 – Pending sales, 73.5% more than October
- 4.6 – Months of inventory, 1.9 months more than October 2022.
- $16,851,436 – Total dollar volume of homes sold, 50.8% more than October


