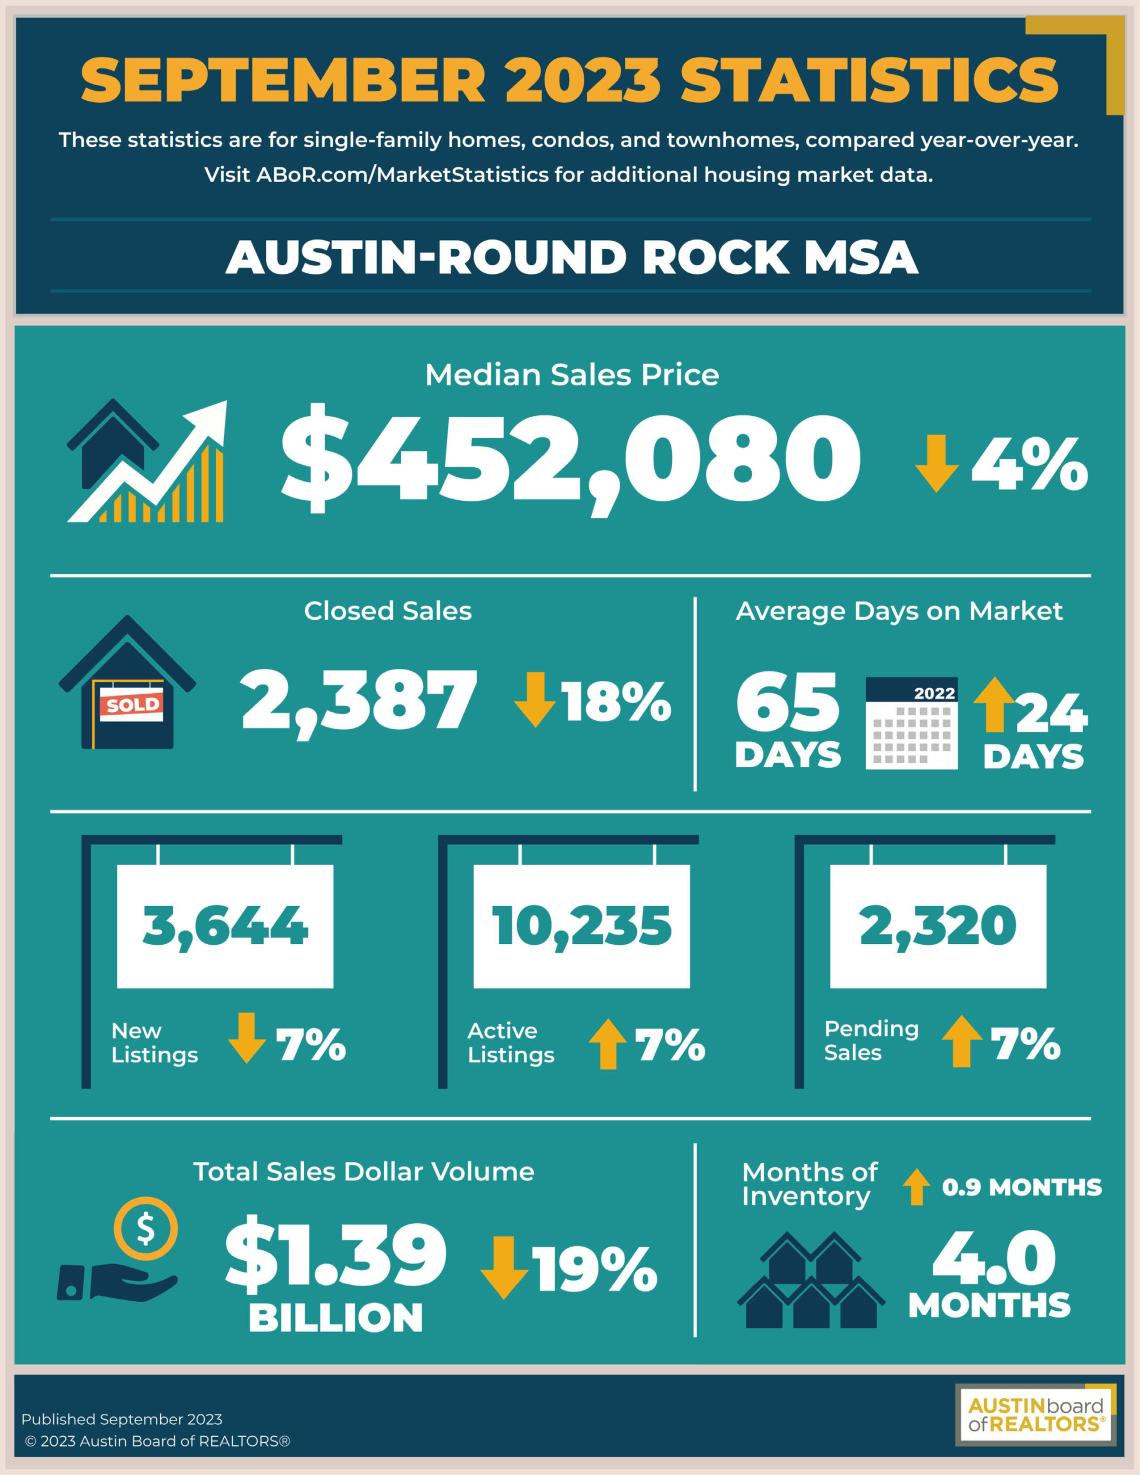
In the Austin-Round Rock MSA, housing inventory reached 4 months of inventory, the highest level in more than eight years, according to the Austin Board of Realtors' September 2023 Central Texas Housing Market Report. The market also experienced a drop in closed sales, which decreased by 18.2% year over year to 2,387 sales, and the median close price dipped 4.3% year over year to $452,080, both symptomatic of higher mortgage rates.
In September, sales dollar volume fell 19.8% year over year to $1,390,205,344, while homes spent an average of 65 days on the market, up 24 days from September 2022 across the Austin-Round Rock MSA. New listings decreased 7.0% year over year to 3,644 listings, active listings jumped 7.8% year over year to 10,235 listings and pending listings rose 7.7% year over year to 2,320 listings. There were 2,387 residential homes sold across the MSA, a 18.2% decrease from September 2022.
As the inventory of homes for sale continues to increase, there is still a limited supply of affordable housing options available for Austin residents.
“While our current market shows signs of health with more housing supply becoming available, they are not necessarily attractive options for first-time homebuyers or those shopping for more affordable homes," said ABorR's' Clare Losey, Ph.D., housing economist for ABoR, noted that The current inventory level across the MSA demonstrates that while we’ve seen a steady increase in supply over the past year, many of these homes are not attainable for the average Austin resident.”
 ABoR
ABoR
City of Austin
- 682 – Residential homes sold, 13.3% less than September 2022.
- $536,028 – Median price for residential homes, 2.5% less than September 2022.
- 1,116 – New home listings on the market, 11.2% less than September 2022.
- 2,968 – Active home listings on the market, 14.2% more than September 2022.
- 628 – Pending sales, 2.6% more than September 2022.
- 4.1 – Months of inventory, 1.4 months more than September 2022.
- $463,473,176 – Total dollar volume of homes sold, 15.4% less than September 2022.
Travis County
- 1,085 – Residential homes sold, 12.7% less than September 2022.
- $525,000 – Median price for residential homes, 4.2% less than September 2022.
- 1,737 – New home listings on the market, 12.9% less than September 2022.
- 4,875 – Active home listings on the market, 9.4% more than September 2022.
- 994 – Pending sales, 0.5% more than September 2022.
- 4.2 – Months of inventory, 1.2 months more than September 2022.
- $768,624,857 – Total dollar volume of homes sold, 12.0% less than September 2022.
Williamson County
- 791 – Residential homes sold, 20.4% less than September 2022.
- $426,752 – Median price for residential homes, 6.1% less than September 2022.
- 1,070 – New home listings on the market, 10.5% less than September 2022.
- 2,873 – Active home listings on the market, 10.6% less than September 2022.
- 807 – Pending sales, 9.7% more than September 2022.
- 3.3 – Months of inventory, 0.2 months more than September 2022.
- $388,535,209 – Total dollar volume of homes sold, 23.4% less than September 2022.
Hays County
- 341– Residential homes sold, 30.3% less than September 2022.
- $400,000 – Median price for residential homes, 4.3% less than September 2022.
- 557 – New home listings on the market, 19.0% more than September 2022.
- 1,685 – Active home listings on the market, 37.9% more than September 2022.
- 356 – Pending sales, 24.5% more than September 2022.
- 4.7 – Months of inventory, 1.5 months more than September 2022.
- $169,681,296 – Total dollar volume of homes sold, 38.1% less than September 2022.
Bastrop County
- 133 – Residential homes sold, 11.9% less than September 2022.
- $340,000 – Median price for residential homes, 10.7% less than September 2022.
- 199 – New home listings on the market, 6.1% less than September 2022.
- 610 – Active home listings on the market, 23.5% more than September 2022.
- 112 – Pending sales, 5.9% less than September 2022.
- 5.0 – Months of inventory, 1.2 months more than September 2022 and the highest inventory in the MSA.
- $50,253,715 – Total dollar volume of homes sold, 22.9% less than September 2022.
Caldwell County
- 37– Residential homes sold, 9.8% less than September 2022.
- $289,330 – Median price for residential homes, 13.9% less than September 2022.
- 81 – New home listings on the market, 68.8% more than September 2022.
- 192 – Active home listings on the market, 77.8% more than September 2022.
- 51 – Pending sales, 112.5% more than September 2022.
- 4.7 – Months of inventory, 2.1 months more than September 2022.
- $11,872,930 – Total dollar volume of homes sold, 11.0% less than September 2022.