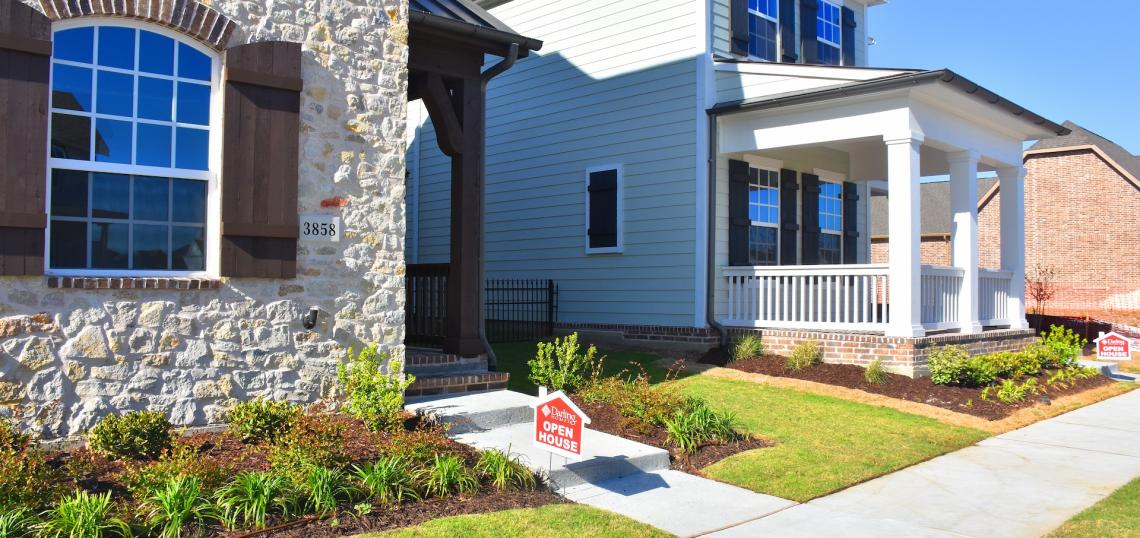
Home sales slowed, prices dropped, and inventory rose in the Austin-Round Rock-San Marcos metro area in June, continuing a market trend that characterized the first half of 2024, according to the Austin Board of Realtors' June and Mid-year 2024 Central Texas snapshot.
In June, the number of homes for sale in the Austin area rose almost 26 percent, to 13,227 active listings, according to the report, which crunched the numbers for the month of June and the first half of the year.
From January through June, the number of active listings increased 15.5% year over year in the MSA.
Below are the June and midyear stats by MSA, city, and county.
Austin-Round Rock-San Marcos MSA: June 2024
- 2,732 – Residential homes sold, 13.4% less than June 2023.
- $450,000 – Median price for residential homes, 6.3% less than June 2023.
- 4,364 – New home listings on the market, 3.9% less than June 2023.
- 13,227 – Active home listings on the market, 25.9% more than June 2023.
- 2,802 – Pending sales, 2.4% less than June 2023.
- 5.0 – Months of inventory, 1.3 months more than June 2023.
- $1,581,439,443 – Total dollar volume of homes sold, 18.0% less than June 2023.
- 96.40% – Average close to list price, compared to 94.7% in June 2023.
Austin-Round Rock-San Marcos MSA: Year to Date
- 15,189 – Residential homes sold, 1.8% less than the first half of 2023.
- $450,000 – Median price for residential homes, 2.2% less than the first half of 2023.
- 26,398 – New home listings on the market, 15.4% more than the first half of 2023.
- 63,005 – Active home listings on the market, 15.5% more than the first half of 2023.
- 16,676 – Pending sales, 1.6% more than the first half of 2023.
- $8,780,135,436 – Total dollar volume of homes sold, 2.7% less than the first half of 2023.
City of Austin: June 2024
- 868 – Residential homes sold, 21.0% less than June 2023.
- $600,000 – Median price for residential homes, 1.6% less than June 2023.
- 1,661 – New home listings on the market, 10.0% less than June 2023.
- 5,632 – Active home listings on the market, 43.4% more than June 2023.
- 910 – Pending sales, 12.2% less than June 2023.
- 5.8 – Months of inventory, 1.9 months more than June 2023.
- $665,437,038 – Total dollar volume of homes sold, 23.6% less than June 2023.
- 95.2% – Average close to list price, compared to 95.48% in June 2023.
City of Austin: Year to Date
- 5,172 – Residential homes sold, 2.9% less than the first half of 2023.
- $574,995– Median price for residential homes, flat compared to the first half of 2023.
- 9,987 – New home listings on the market, 11.5% more than the first half of 2023.
- 23,289 – Active home listings on the market, 24.9% more than the first half of 2023.
- 5,636 – Pending sales, 1.7% less than the first half of 2023.
- $3,895,461,068 – Total dollar volume of homes sold, 3.3% less than the first half of 2023.
Travis County: June 2024
- 1,210 – Residential homes sold, 18.6% less than June 2023.
- $525,000 – Median price for residential homes, 3.7% less than June 2023.
- 2,122 – New home listings on the market, 9.9% less than June 2023.
- 6,819 – Active home listings on the market, 29.9% more than June 2023.
- 1,224 – Pending sales, 9.4% less than June 2023.
- 5.8 – Months of inventory, 1.8 months more than June 2023.
- $842,700,113 – Total dollar volume of homes sold, 21.9% less than June 2023.
- 97.2% – Average close to list price, compared to 94.9% in June 2023.
Travis County: Year to Date
- 6,830 – Residential homes sold, 4.8% less than the first half of 2023.
- $520,000 – Median price for residential homes, 0.1% more than the first half of 2023.
- 12,981 – New home listings on the market, 11.2% more than the first half of 2023.
- 31,533 – Active home listings on the market, 21.4% more than the first half of 2023.
- 7,453 – Pending sales, 2.6% less than the first half of 2023.
- $4,779,938,098 – Total dollar volume of homes sold, 4.0% less than the first half of 2023.
Williamson County: June 2024
- 945 – Residential homes sold, 15.1% less than June 2023.
- $434,000 – Median price for residential homes, 3.6% less than June 2023.
- 1,357 – New home listings on the market, 2.0% less than June 2023.
- 3,727 – Active home listings on the market, 23.0% more than June 2023.
- 976 – Pending sales, 1.3% less than June 2023.
- 4.1 – Months of inventory, 1.1 months more than June 2023.
- $472,989,836 – Total dollar volume of homes sold, 17.8% less than June 2023.
- 95.7% – Average close to list price, compared to 94.51% in June 2023.
Williamson County: Year to Date
- 5,254 – Residential homes sold, 3.9% less than the first half of 2023.
- $430,000 – Median price for residential homes, 1.6% less than the first half of 2023.
- 8,051 – New home listings on the market, 14.8% more than the first half of 2023.
- 17,613 – Active home listings on the market, 5.7% more than the first half of 2023.
- 5,746 – Pending sales, 0.2% more than the first half of 2023.
- $2,555,608,499 – Total dollar volume of homes sold, 5.7% less than the first half of 2023.
Hays County: June 2024
- 413 – Residential homes sold, 1.7% more than June 2023.
- $391,775 – Median price for residential homes, 7.8% less than June 2023.
- 623 – New home listings on the market, 5.4% more than June 2023.
- 1,908 – Active home listings on the market, 20.4% more than June 2023.
- 416 – Pending sales, 6.9% more than June 2023.
- 4.9 – Months of inventory, 0.7 months more than June 2023.
- $205,309,071 – Total dollar volume of homes sold, 3.7% less than June 2023.
- 95.8% – Average close to list price, compared to 94.0% in June 2023.
Hays County: Year to Date
- 2,202 – Residential homes sold, 5.7% more than the first half of 2023.
- $385,000 – Median price for residential homes, 3.8% less than the first half of 2023.
- 3,783 – New home listings on the market, 28.1% more than the first half of 2023.
- 9,703 – Active home listings on the market, 16.2% more than the first half of 2023.
- 2,471 – Pending sales, 12.1% more than the first half of 2023.
- $1,092,777,071 – Total dollar volume of homes sold, 5.8% more than the first half of 2023.
Bastrop County: June 2024
- 111 – Residential homes sold, 1.5% more than June 2023.
- $339,450 – Median price for residential homes, 10.7% less than June 2023.
- 198 – New home listings on the market, 26.9% more than June 2023.
- 633 – Active home listings on the market, 23.9% more than June 2023.
- 140 – Pending sales, 29.6% more than June 2023.
- 5.7 – Months of inventory, 1.1 more than June 2023.
- $42,857,579 – Total dollar volume of homes sold, 10.7% less than June 2023.
- 94.7% – Average close to list price, compared to 93.6% in June 2023.
Bastrop County: Year to Date
- 661 – Residential homes sold, 12.0% more than the first half of 2023.
- $360,000 – Median price for residential homes, 5.2% less than the first half of 2023.
- 1,206 – New home listings on the market, 29.8% more than the first half of 2023.
- 3,295 – Active home listings on the market, 12.4% more than the first half of 2023.
- 717 – Pending sales, 12.2% more than the first half of 2023.
- $268,529,211 – Total dollar volume of homes sold, 8.6% more than the first half of 2023.
Caldwell County: June 2024
- 57 – Residential homes sold, 45.0% more than June 2023.
- $300,000 – Median price for residential homes, 7.1% more than June 2023.
- 61 – New home listings on the market, 8.9% more than June 2023.
- 138 – Active home listings on the market, 8.1% more than June 2023.
- 44 – Pending sales, 25.7% more than June 2023.
- 3.0 – Months of inventory, 0.3 months less than June 2023.
- $18,869,166 – Total dollar volume of homes sold, 42.2% more than June 2023.
- 95.9% – Average close to list price, compared to 97.9% in June 2023.
Caldwell County: Year to Date
- 242 – Residential homes sold, 60.3% more than the first half of 2023.
- $299,945 – Median price for residential homes, flat compared to the first half of 2023.
- 377 – New home listings on the market, 23.6% more than the first half of 2023.
- 861 – Active home listings on the market, 36.2% more than the first half of 2023.
- 289 – Pending sales, 54.5% more than the first half of 2023.
- $83,282,558 – Total dollar volume of homes sold, 58.4% more than the first half of 2023.


